About a month ago I started collecting tweets for the Bay Area and storing them in MongoDB. Now that I have a small collection of data (~1.3 million tweets) I decided to spend my weekend building an application that utilizes the power of MongoDBs full text search.
This application lets you explore keyword search in space, time and content. Its best understood by looking at the following examples.
1. UC Berkeley explosion
The first example is for the search term: explosion. You can see from the heat-map that spatially the search term is focused mostly at the UC Berkeley campus. Looking at the timeline we can see only one significant event on the evening of October 1st.


The tweet content (text and photos) tell us even more about what happened.

The event above was in fact an explosion on the UC Berkeley Campus which happened at 6:40 p.m Monday, October 1st. It was caused by vandals attempting to steal copper grounding wire from an electrical system.
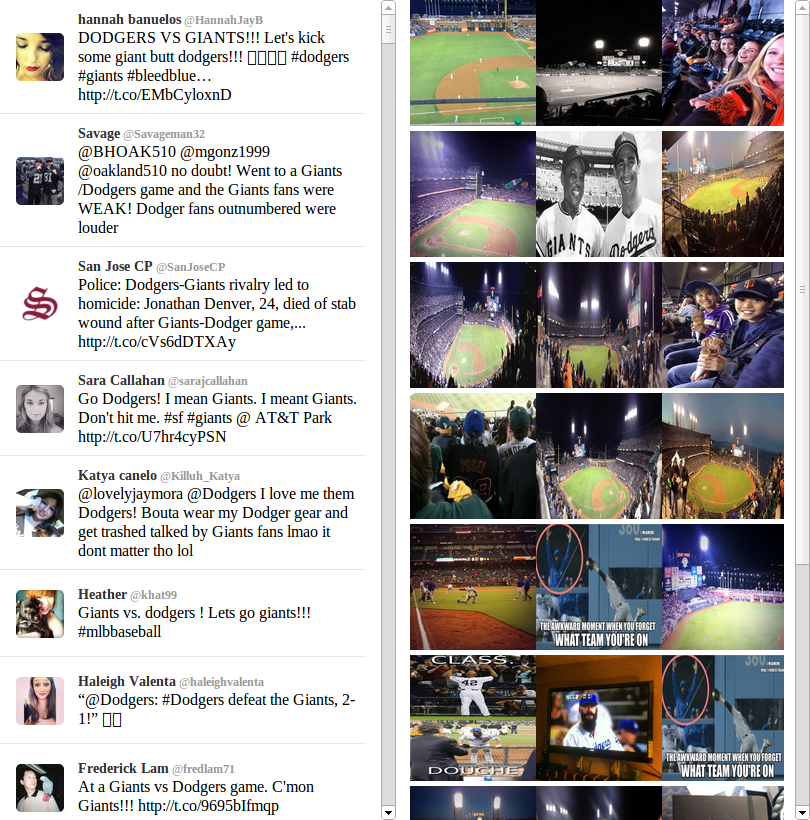
2. Giants vs Dodgers
The second example is for the search terms: giants and dodgers. You can see from the heatmap that people are talking about this from a lot of places but most of the heat is centered around AT&T Park. Looking at the timeline we can see 3 significant events, these peaks coincide with the 3 days the San Francisco Giants played against the Los Angeles Dodgers.

Once again the tweet content tells us whats happening at a finer level. From the photos we see lots of people at the ballpark.
3. iPhone5
The third and final example is for the search term: iphone5. Not surprisingly the heat for this term is centered on San Francisco and Palo Alto. The timeline shows one significant event September 21st which is the launch day for the iphone5.

Once again the content tells a great story, please exciting, queuing outside the AT&T store in San Francisco, waiting for their new iphone5.

4. Starbucks
This is a much more general query and therefore guaranteed to return lots of documents. Despite this Mongo, Leaflet, Heatmap.js and Flot still did a great job. What follows was drawn in about 1 second. The photos took a little longer to resolve they just slowly appeared in their own time.

The content of the tweets is as expected.

Final thought
The above is really a testament to the great work done by the MongoDB team. The only reason I was able to build something this cool in a single weekend was because they did such an awesome job. So thank you MongoDB team, I tip my proverbial hat to you.
If your interested in any of my projects consider connecting with me on LinkedIn.
If your interested in any of my projects consider connecting with me on LinkedIn.
Hi.
ReplyDeleteFirst of all, awesome work. Congratulations!
Im from Brazil and I have a blog that I write about MongoDB, Python and NoSQL. I work with analytics and Big Data in a big company. Do you mind if I publish this post in my blog?
Thank you.
Leandro Guerra
Hi Leandro,
ReplyDeletePlease do, this sounds great.
Cathal
Great! Tks Cathal. Ill let you know when I publish.
ReplyDeletemmorpg oyunlar
ReplyDeleteinstagram takipçi satın al
tiktok jeton hilesi
Tiktok Jeton Hilesi
antalya saç ekimi
instagram takipçi satın al
İnstagram Takipçi
metin2 pvp serverlar
instagram takipçi satın al
Tül Perde Modelleri
ReplyDeletesms onay
mobil ödeme bozdurma
NFTNASİLALİNİR.COM
ANKARA EVDEN EVE NAKLİYAT
trafik sigortasi
dedektör
web sitesi kurma
ask romanlari
360DigiTMG offers the best Data Analytics courses in the market with placement assistance. Enroll today and fast forward your career.
ReplyDelete<a href="https://360digitmg.com/india/business-analytics-training-in-patna''>business analytics course in patna</a>
üsküdar daikin klima servisi
ReplyDeletependik samsung klima servisi
tuzla toshiba klima servisi
çekmeköy lg klima servisi
çekmeköy alarko carrier klima servisi
ataşehir alarko carrier klima servisi
çekmeköy daikin klima servisi
ataşehir daikin klima servisi
maltepe toshiba klima servisi