Recently, I have begun to think of the Capital Bikeshare network as a Graph. Where the stations are the Nodes and the bikes that move among them form the Edges. What would such a graph look like? Well it would contain 191 nodes and 22,694 edges. 22,694 edges is actually not so many, we can still draw this in a web-browser if were smart and use WebGL.
To describe the overlapping communities I have used pie charts instead of circles for the nodes. OSLOM doesn't weight ownership, so the pies will always be divided into n equal slices where n is the number of communities that the node belongs to. The other interesting thing OSLOM provides is a statistical measure called BS. The BS value for the orange community shown above is 0.136751. BS is an estimation of the probability of finding a module like this one in a random network.
 |
| WebGL rendered graph with 191 nodes and 22,694 edges |
If your thinking I can't see any interesting patterns, its too dense your absolutely right and I agree with you. Remember, our visualization is rendered using WebGL so we can explore all day and experience zero lag. We can zoom and pan around, but to be honest we still don't learn very much, apart from the obvious fact that WebGL is awesome.
 |
| Zoomed in view containing 2 stations and a lot of edges |
Hiding Edges
Okay so the edges are the problem, what if we don't draw them all at once? What if we only draw the edges for a node when we are hovered over it? We end up with a visualization like the following.
 |
| Hover and explore, station by station |
This isn't a totally useless tool. You can now explore each station in turn and see only the edges that link to/from that station. This is great for finding stations with higher or lower than expected flow or for finding stations with asymmetric flow. It still isn't what we want tho, we want to know more about how the stations interact.
Community Detection
Next, I decided to run community detection algorithms on the Graph. These algorithms will partition the graph into different groups of nodes. There are many different community detection algorithms, to name but a few: Infomap, OSLOM, Copra, Louvain. I have chosen to evaluate the results of two algorithms, Infomap and OSLOM. These techniques are very different in their approach but they should yield similar answers.
Infomap
The fundamental idea behind Infomap really appeals to me. As soon as I finished reading about it, I just had to throw my data at it. In a nutshell: Infomap finds the partition, that minimizes the description length of a binary code, necessary to describe a random walkers movements on a network. I am a visual learner so I consider this visualisation to be the best explanation of Infomap.
One of the most interesting things about the results Infomap returns is the spatial cohesion. The algorithm wasn't given the co-ordinates of the stations. In fact it has no geographic information whatsoever, yet the results are these beautiful, geographically cohesive, communities.
 |
| Communities found by Infomap |
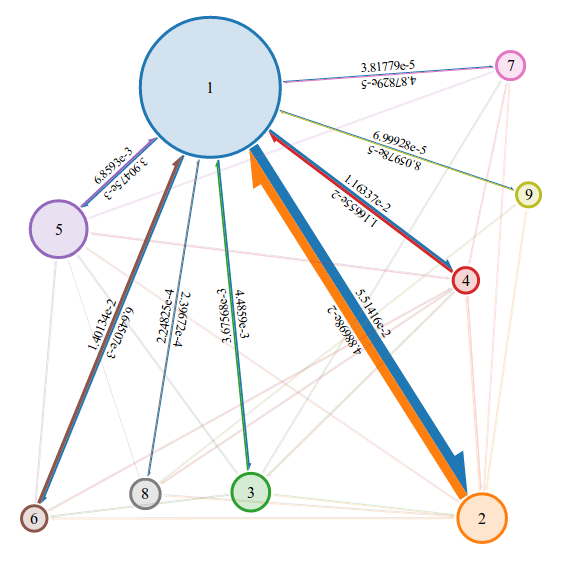
Its not enough to show these communities alone, we also need to see how they are connected and with what strength. For this I have created a force directed layout that displays each community and the links between them. Learning from an earlier example, the link strengths are only displayed when you hover over a node.

OSLOM
Infomap & OSLOM both work on connected directed/un-directed, weighted/un-weighted graphs. They also both find hierarchical community structure. OSLOM is however very different from Infomap, for one, it believes in overlapping communities. This belief allows any node to belong to any number of communities. Also the fundamental idea behind OSLOM is also very different than that of Infomap. In a nutshell: OSLOM compares structures found in your Graph to a completely random graph. It is therefor able to tell if a structure is truly interesting and not just the result of random connections.
 |
| Communities found by OSLOM |
To describe the overlapping communities I have used pie charts instead of circles for the nodes. OSLOM doesn't weight ownership, so the pies will always be divided into n equal slices where n is the number of communities that the node belongs to. The other interesting thing OSLOM provides is a statistical measure called BS. The BS value for the orange community shown above is 0.136751. BS is an estimation of the probability of finding a module like this one in a random network.
 |
| OSLOM overlapping nodes use pie charts to display membership |
Conclusion
Infomap and OSLOM both find strong, geographical cohesive, community structure in the Capital Bikeshare network. These algorithms both provide different answers to the question "What is the community structure of this network"? This is however not a surprising result as the exact definition of a community is still an open question.
Infomap finds communities based on flow. This is very appealing as a bike share network can easily be seen as a flow network. Bikes don't teleport (actually sometimes they do because of the redistribution/balancing trucks) however in general they flow from station to station. If a bike is moved from station a to station b then its next move must begin at station b.
OSLOM finds communities by asking the question "How statistically unlikely am I to find this configuration in a random graph"?
How can we use these communities to our advantage? Well they give us a high level overview of the system. We can almost think of each community as its own bike network. Most of the bike trips stay within their community, in fact, if this wasn't true then we wouldn't find communities at all. A certain number of bikes do however flow between the communities, these flows are illustrated in the above graph.
About the visualization
The first two graphs use leaflet and WebGL. You might have noticed that I didn't post a URL to the live example, this was done for two reasons. 1) The code is very hacked together and 2) It was an experiment that a friend and I worked on. He did more work than me and he is hoping to take this WebGL network project even further. So I will not be posting his unstable first attempt here.
The second graph was created using Leaflet and D3. Leaflet simply cannot render 22,694 polylines in a fast, lag free way. So this graph actually sparked the idea of creating the WebGL graph.
For the Infomap visualizations, the maps were created using Leaflet and D3 as normal. Initially I drew convex hulls around the communities but I found that this distorted the actually area and overlap of the communities. So I ended up using Alpha shapes instead. I am using
Ken Clarkson from bell labs implementation. The beautiful force directed graphs were drawn using JSNetworkX which was written by the seriously talented Felix Kling.
For the OSLOM visualizations, the only difference is the pie charts. These were drawn using the leaflet semi-circle extension by jieter.